Goal and Background
The goal of this lab was to introduce us students to the principles of extracting land surface temperatures from a variety of Earth features using the thermal bands of different Landsat satellites. This lab was also designed so that we would develop an understanding of surface temperature variations over time and space, developing models to derive surface temperature, and combining simple models to form more complex models.
Methods
Part 1: Visual identification of relative variations in land surface temperature
Part 1 of this lab was all about an introductory into viewing remotely sensed thermal images. To do this, different thermal images from Landsat ETM+ band 6, both high gain and low gain, were provided so that we could compare the tonal differences between the two different images.
Part 2: Calculation of land surface temperature from ETM+ image
Part 2 of this lab was all about developing two separate and simple models to first take the provided ETM+ image and convert it into an at-satellite radiance image. To do this, a simple model with the equation Grescale * DN + Brescale was used with the Grescale and Brescale being calculated from information in the metadata of the image. Once the model was run and the at-satellite radiance image obtained, a second model was created to covert this image into a blackbody surface image that showed surface temperature in degrees Kelvin. This model was run with the provided k1 and k2 calibration constants. The resulting image from this second model was brought into Arcmap so that the identification tool could be used to check the temperature of a variety of surface features.
Part 3: Calculation of land surface temperature from TM image
Part 3 of this lab focused on calculating surface temperatures from a TM image using the same equations from part 2 but instead of two separate models, a single model was used. Just like in part 2, the Grescale and Brescale were calculated using data within the image metadata and then the provided k1 and k2 constants were used. The difference in this model was making sure to check the "Temporary Raster Only" radio button in the output at-satellite radiance image so that no image would be saved and the model could just use that temporary image to finish the conversion to a land surface temperature image. The resulting image showed surface temperatures in degrees Kelvin for the Eau Claire area and was used to answer some questions about specific land features temperatures.
Part 4: Calculation of land surface temperature from Landsat 8 image
Part 4 of this lab was nearly identical to part 3, but instead used and image from Landsat 8 rather than TM. The only difference that occurred because of this difference in which satellite was used was that the k1 and k2 constants were located in the metadata rather than provided by the instructor. The same model from part 3 was run on the image after it had been subsetted to just Eau Claire and Chippewa counties. The resulting surface temperature image was then brought into Arcmap where it was cleaned up and labeled into a standalone map.
Results
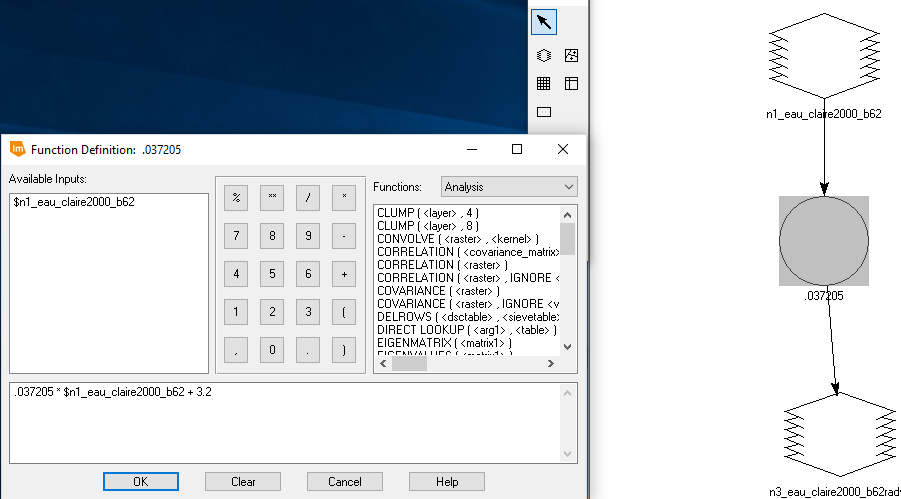
Example of model from part 2: conversion to an at-satellite radiance image
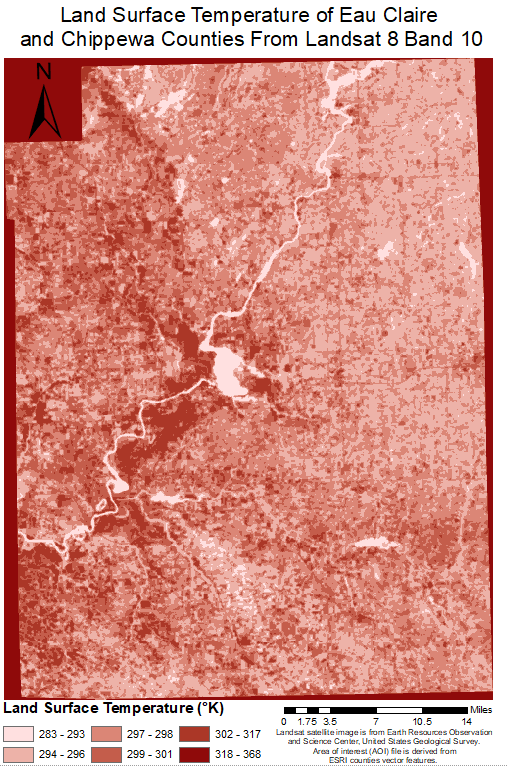
Final map of Landsat 8 thermal image
Sources
Landsat satellite image is from Earth Resources Observation and
Science Center, United States Geological Survey
Area of interest (AOI) file is derived from
ESRI counties vector features.


No comments:
Post a Comment