Goal and Background
The goal of this lab was to develop an understanding and experience in the atmospheric correction of images using both relative and absolute atmospheric correction models. These models included Empirical Line Calibration (ELC), Image Based Dark Object Subtraction (DOS), and Multi-Date Image Normalization.
Methods
Part 1: Absolute atmospheric correcting using empirical line calibration
For part 1, ELC was calculated with the following equation, where DN was the band(s) to be corrected, M was a multiplicative term for the brightness value, and L was an additive term.


Using the Raster>Hyperspectral>Spectral Analysis Workstation tool as well as the Atmospheric Adjustment tool, we were able to collect points on vegetation, concrete, and other surface features and compare their spectral profiles to those within the ASTER and USGS V4 spectral libraries. In the Spectral Analysis Workstation we then ran the Preprocess>Atmospheric Adjustment model to create an output atmospherically corrected image that used the ELC equation and information collected above. This image was then compared to the original uncorrected image to judge how well this correction method works.
Part 2: Absolute atmospheric correction using enhanced image based Dark object subtraction
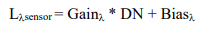
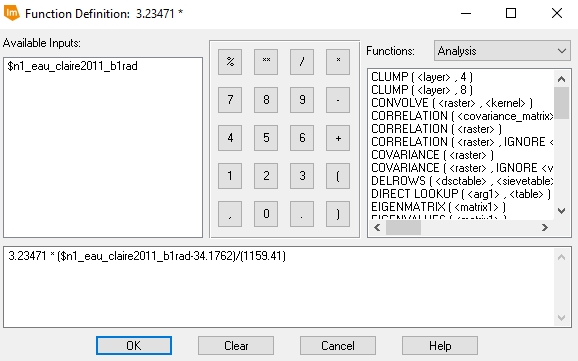
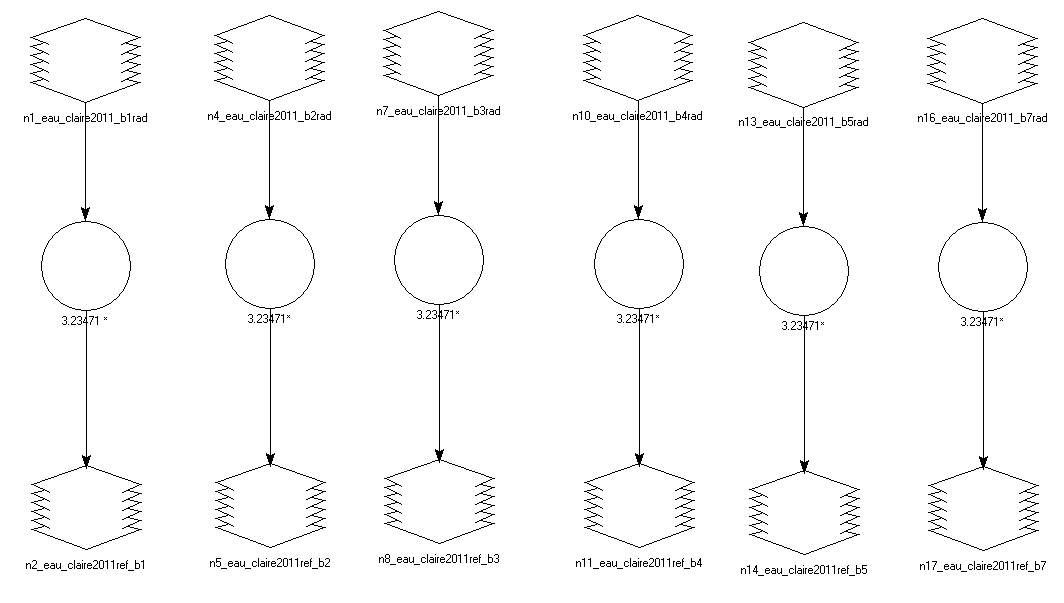
The first step in atmospherically correcting an image using the DOS method was to create a model that converted the satellite image to at-satellite spectral radiance for bands 1-5 and 7 simultaneously. To do this, the equation below was used using data collected form the metadata text file associated with the individual band images.


Next, the at-satellite spectral radiance images for each individual band that were the results of the model were then converted to true surface reflectance using the equation below with values calculated from the histograms of the radiance images, distance between the Earth and Sun calculated from an Earth-Sun distance table, the Sun zenith angle calculated from the image metadata file, and the Esun value from a table on Landsat TM.

Once both models were completed, true surface reflectance images for each band were layer stacked and then spectral profiles of a variety of features were collected to compare to the original uncorrected image.
Part 3: Relative atmospheric correction using multi-date image normalization
The first step in multi-date image normalization was to collect points off of pseudo-invariant features from base image and subsequent image. This was done by using the same Spectral Profile tool used elsewhere in the lab. The tabular data from these spectral profiles were then copied into Excel where scatter plots were created and regression equations were calculated. Using the values in the regression equations, a model was created to correct each individual band to create individual images of each band that were corrected. To do this, the following equation was used.
Once the model was run, the resulting corrected band images were layer stacked to create a false color image that was then compared to the original image.
Results


Example model and equation for conversion of image to at-satellite spectral radiance image
Example of model and equation for at satellite spectral radiance to true surface reflectance

Chicago 2000 Image Spectral Profiles
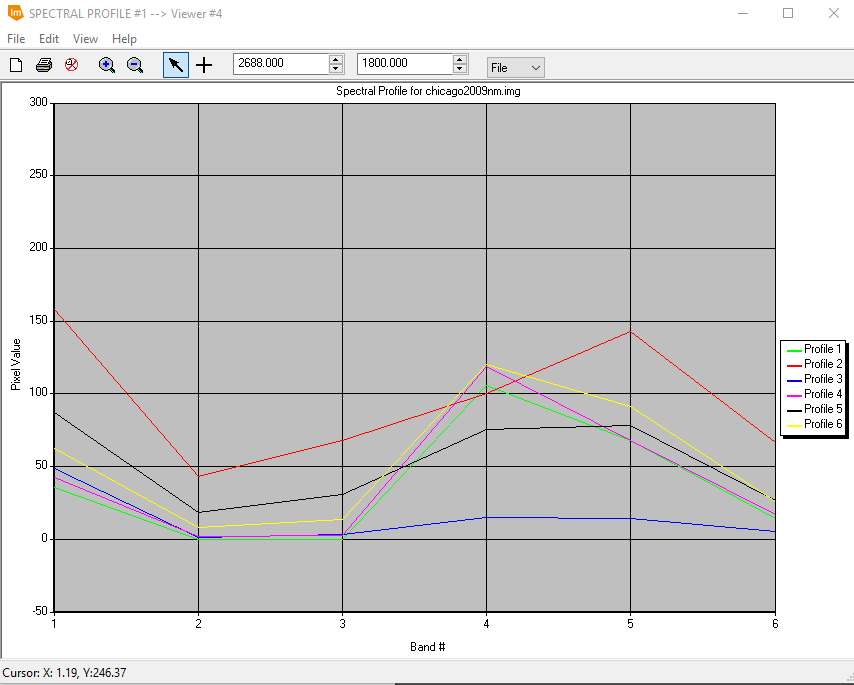
Chicago 2009 Image Spectral Profiles

Scatter Plots of Mean Pixel Values per Band

Spectral Profiles of Chicago 2000 and Chicago 2009 After Relative Correction
Sources
Landsat satellite image is from Earth Resources Observation and
Science Center, United States Geological Survey.
Spectral signatures are from the respective spectral libraries consulted - ASTER, USGS V4


No comments:
Post a Comment